Built automatically by the CI/CD pipeline with ctgame 0.1.0 on synthetic data (no real student data). Source: github.com/beliyaka98/ctgame-analytics
120 students, 40 tasks, 3648 attempts; 59% of student-task pairs were tried.
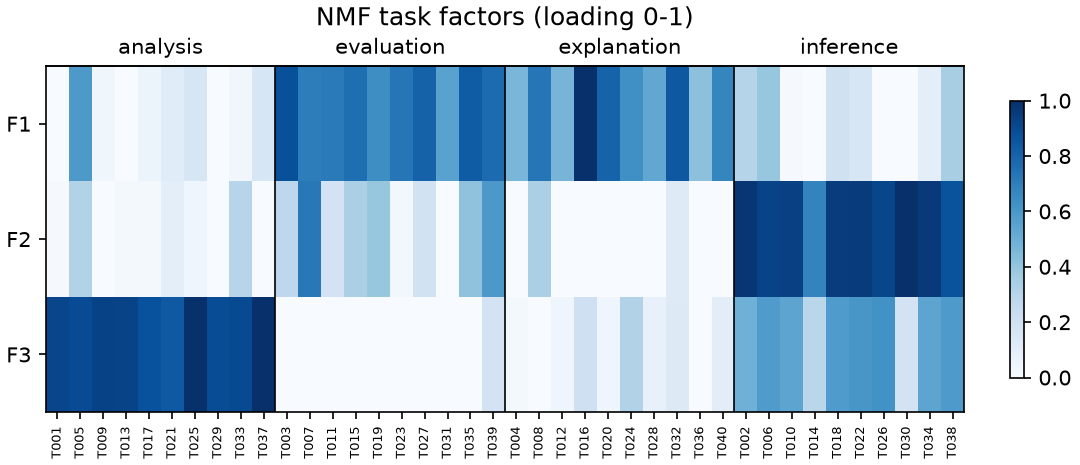
3 factors, RMSE on observed cells = 0.3213, 151 iterations, converged: True. On 20% held-out attempts the prediction error is 0.3727 against 0.4376 for the task-mean baseline (15% lower).
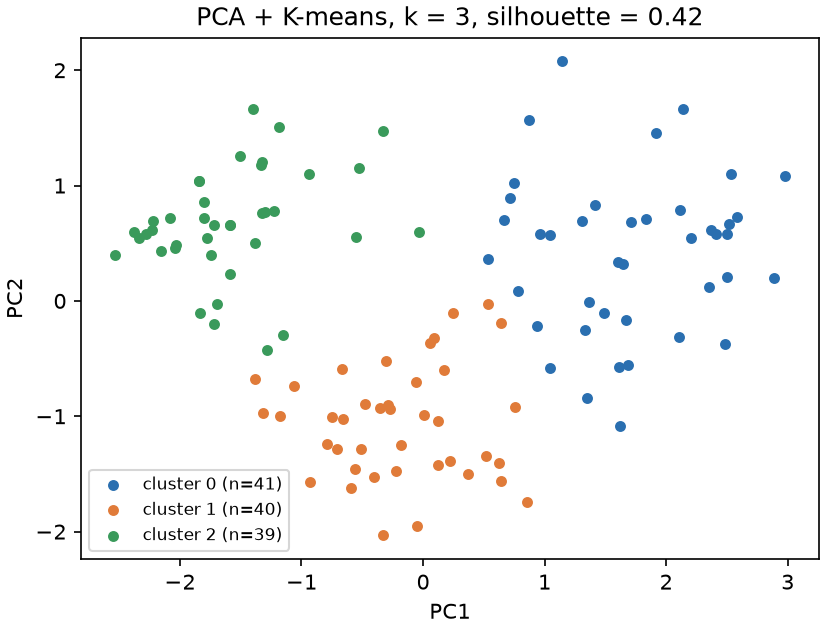
Best k = 3 by silhouette; cluster sizes [41, 40, 39].
| success_analysis | success_evaluation | success_explanation | success_inference | |
|---|---|---|---|---|
| cluster | ||||
| 0 | 0.32 | 0.75 | 0.62 | 0.40 |
| 1 | 0.27 | 0.53 | 0.22 | 0.93 |
| 2 | 0.90 | 0.13 | 0.17 | 0.82 |
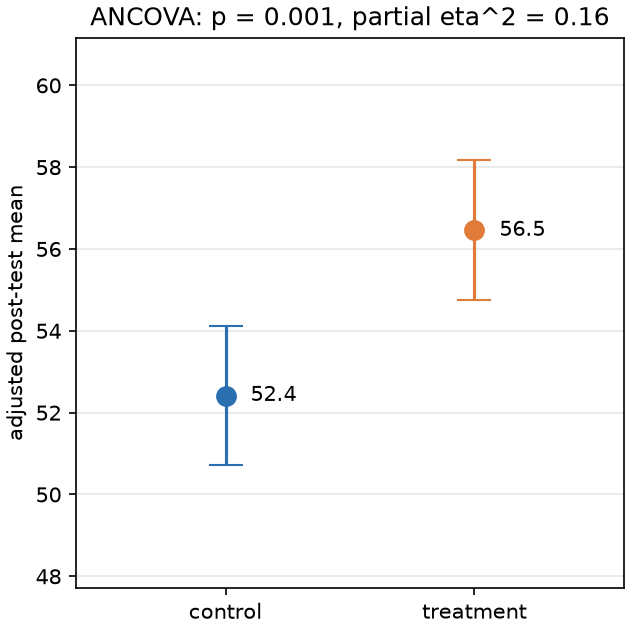
F(1, 57) = 11.16, p = .001, partial eta^2 = 0.16; adjusted difference = 4.04 [95% CI 1.62, 6.45]. Assumptions met: True.
| student_id | task_id | reason | predicted_success | observed_success | distance |
|---|---|---|---|---|---|
| S001 | T008 | new | 0.83 | NaN | 0.13 |
| S001 | T015 | new | 0.86 | NaN | 0.16 |
| S001 | T027 | new | 0.90 | NaN | 0.20 |
| S002 | T034 | new | 0.88 | NaN | 0.18 |
| S002 | T018 | new | 0.89 | NaN | 0.19 |
| S002 | T030 | new | 0.90 | NaN | 0.20 |
| S003 | T014 | new | 0.59 | NaN | 0.11 |
| S003 | T010 | new | 0.96 | NaN | 0.26 |
| S003 | T039 | new | 0.44 | NaN | 0.26 |
| S004 | T038 | new | 0.67 | NaN | 0.03 |
| S004 | T019 | new | 0.78 | NaN | 0.08 |
| S004 | T031 | new | 0.62 | NaN | 0.08 |
| S005 | T038 | new | 0.76 | NaN | 0.06 |
| S005 | T014 | new | 0.60 | NaN | 0.10 |
| S005 | T018 | new | 0.84 | NaN | 0.14 |
Full tables: recommendations.csv, clusters.csv, summary.json.